Selecting a N fertilizer rate when corn is $7/bu
Carrie Laboski, Extension Soil Scientist, Dept. of Soil Science, Univ. of Wisconsin-Madison
With the current price of corn in the $7/bu range, growers and agronomists have been asking if they should reconsider their N application strategy with regard to rate, time of application, and use of inhibitors or slow release products. This article will address the issues that growers and agronomists need to consider when selecting a N application rate.
Selecting a N fertilizer rate. Using the MRTN (maximum return to N) approach to selecting a N fertilizer rate is just as valid this spring as it is any spring. A key thing to remember is that when N and corn price levels increase, risk increases. The N rate guidelines are provided in Table 1. The first step in selecting an appropriate N rate is to identify the previous crop and soil yield potential for your field. The soil yield potential is based on soil properties such as water holding capacity, drainage class, depth of root zone, and length of growing season. A table listing each soil’s yield potential can be found in UWEX publication A2809 Nutrient application guidelines for field, vegetable, and, fruit crops in Wisconsin. (http://www.soils.wisc.edu/extension/pubs/A2809.pdf)
The next step in selecting an appropriate N rate is to determine the N to corn price ratio. If the N:corn price ratio is calculated based on prices that are relevant today, $0.54/ lb N and $7/bu corn, then the ratio is 0.08. (See calculating the N:corn price ratio below for instructions on this calculation.) This price ratio is not all that different than it has been over the past several years. A price ratio of 0.08 falls between two of the price ratios on the N rate guidelines table (see Table 1). The N rates in the 0.10 price ratio column can be used for this situation because the 0.08 price ratio rounds to 0.10. Alternatively, a grower can select a N rate that is between the rates in the 0.05 and 0.10 columns.
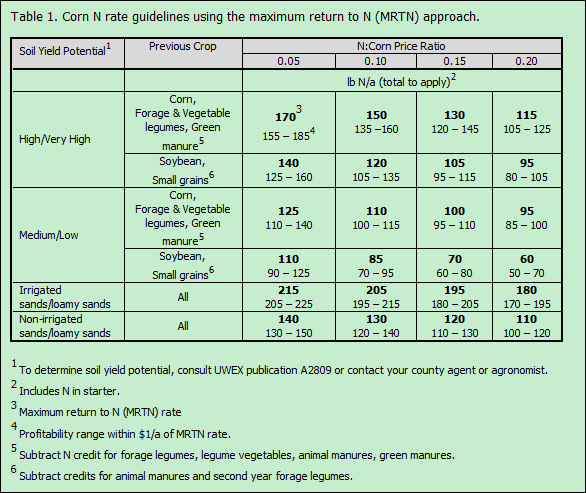
Growers and agronomists should be aware that as price levels increase there is greater risk of reducing profitability by applying too much N. Figure 1 shows the return to N fertilizer when the N:corn price ratio is fixed 0.10, but the price levels change; for example, $0.40/ lb N and $4/bu or $0.60/lb N and $6/bu or $0.80/lb N and $8/bu. These data show that the economic penalty for over application of N fertilizer is much greater at higher price levels and somewhat greater for medium/low yield potential soils compared to high/very high yield potential soils. Thus applying higher than recommended N rates to reduce the risk of losing yield when corn is $7/bu will increase the probability of reducing profitability.
When data in the UW corn N response data base is analyzed, the N rates identified in the 0.05 N:corn price ratio column of Table 1 produce maximum yield. Applying N at rates greater than those suggested for the 0.05 price ratio will never be profitable and are not allowed under current nutrient management regulation. The yield differences between fertilizing at the 0.10 price ratio and the 0.05 price ratio are generally very small, zero to a few bu/a. Remember, if the price ratio that is appropriate for you farm this year is 0.10, applying N at higher rates may get you a couple more bushels of corn, but will reduce profitability.
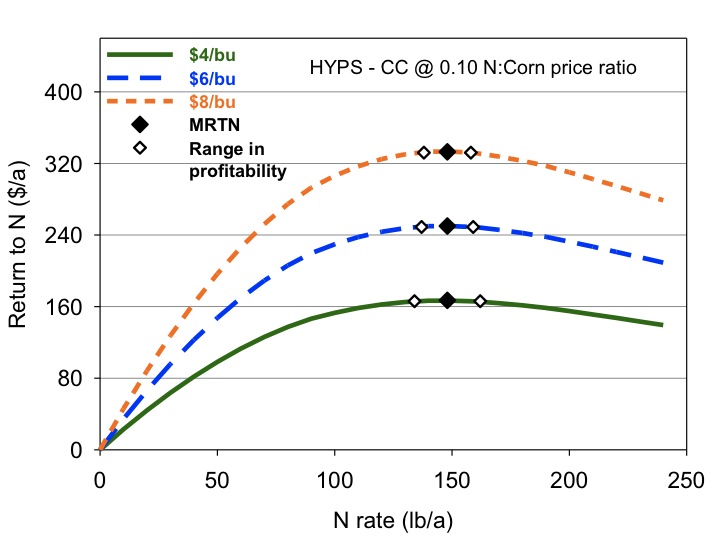
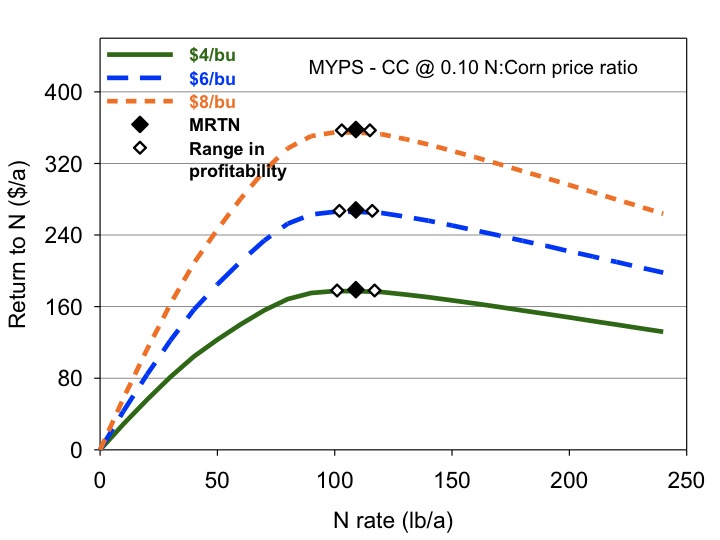
Figure 1. Return to N fertilizer as a function of N applied when the N:corn price ratio is fixed at 0.10 and the price of corn varies from $4/bu to $8/bu. In this graph the MRTN is the suggested N rate for the 0.10 N:corn price ratio. The range in profitability is the range of N rates that produce profitability within $1/a of the MRTN. Data used to develop this graph come from the University of Wisconsin corn N response database for corn following corn on high or very high yield potential soils (TOP) or medium/low yield potential soils (BOTTOM).
Remember to take N credits! The N rates in Table 1 are base N rates and credits still need to be subtracted for manure, forage legumes, vegetable legumes, and green manures as outlined in the table footnotes.
Calculating the N:corn price ratio. The N:corn price ratio is simply the price of N fertilizer in $/lb N divided by the price of corn in $/bu. The price of N in $/lb N can be determined using the following equation: [$/ton fertilizer material x (100 ÷ %N in fertilizer)] ÷ 2000. For example if urea is $500/ton, then the price of per lb N is $0.54/lb N ( [$500/ton x (100 ÷ 46)] ÷ 2000 ).
So if corn is $7/bu, the N:corn price ratio would be $0.54/lb N ÷ $7/bu = 0.08.
Summary. The MRTN N rate guidelines are a tool that helps growers improve the profitability of their N rate decision as N and corn prices fluctuate annually. Over application of N relative to situationally appropriate N:corn price ratios will reduce profitability regardless of how high corn prices are. Higher corn and N prices mean that there is more economic risk associated with over application of N.